Case Study: Diagnosing Revenue Under Uncertainty
A stage-based approach to identifying bottlenecks in a multi-channel system
This case study examines decision-making under uncertainty within a multi-channel B2B e-commerce environment. The work did not focus on improving campaign tactics or performance outcomes.
The work centered on making the underlying revenue system legible enough to diagnose bottlenecks and sequence action deliberately.
The goal was not optimization, but clarity about where intervention would actually matter.
The analysis focused on diagnosing where the system was constrained rather than optimizing individual channels.
Context
Marketing agency setting
Industrial B2B e-commerce client
Monthly reporting cadence (with weekly volatility pressure)
Rolling paid spend decisions
Core Tension
Revenue fluctuated, attribution was contested, and decisions were made reactively in response to small-sample volatility.
The real problem was not lack of data. It was lack of decision architecture.
This work is grounded in my Revenue Research Program.
The Sequencing Breakdown
Measuring before defining decision criteria
Interpreting before establishing interpretive rules
Calibrating spend before diagnosing system stage
Action and evaluation were occurring before system position was known.
That is a sequencing problem. Not a tactical one.
This is exactly the kind of system where a decision framework matters.
Impacts of Lacking A Decision Framework
Several patterns suggested that the apparent instability might reflect interpretation issues rather than purely operational problems.
Small sample over-interpretation
Overreaction to volatility
Acting too soon (premature convergence)
Before adjusting tactics, the priority became understanding how revenue was actually developing over time and whether observed changes represented structural shifts or normal variation.
Channel isolation thinking
Channel favoritism (preference bias, narrative lock-in)
Premature scaling
Overplaying wins / underplaying challenges
Attribution overconfidence (over-trusting what caused outcomes)
Reframing the System
Instead of asking: “What did this channel do last month?”
I reframed the system as:
Acquisition → Conversion → Retention → Returning Customer → Revenue Growth
This framing emphasized progression through stages rather than isolated channel performance.
Analytic Components
Multi-channel path sequencing
Cohort time-series behavior
Proportional contribution modeling
Returning customer frequency
Cross-channel influence
Small-sample volatility awareness
The focus shifted from metrics to system position.
Bottleneck Diagnosis: Misinterpreted System Interactions
The investigation revealed that many apparent performance issues stemmed from misinterpretations of how the system operated rather than from isolated channel failures, including:
Channel interaction misread as channel competition
Multi-channel paths acknowledged but not operationalized
Same-month attribution applied to long purchase cycles
Revenue leakage location unclear due to boundary ambiguity
Small-n volatility mistaken for directional signal
Acquisition activity fluctuates with campaigns, seasonality, and external conditions. Apparent growth or decline often reflects changes in acquisition rather than underlying demand.

Caption. Returning customers provide stability; acquisition drives volatility.
Here, acquisition activity produced visible spikes, but sustained revenue depended heavily on returning customers. Periods that appeared stagnant from a new-customer perspective were often supported by repeat purchasing.
The system’s stability was not being captured by acquisition-focused reporting.
This analysis shifted attention from short-term acquisition performance to the durability of the existing customer base.
Channel Isolation Fallacy
Channels were evaluated as independent purchase mechanisms rather than interacting components in a shared system.
Examples:
“Paid traffic was down, organic was up → paid is underperforming.”
“Direct traffic is stronger YoY → the website is doing well.”
This ignores:
Path dependency
Lagged attribution
Cross-channel influence
Assisted conversions
This perspective reframed channels as interacting components rather than independent drivers.
Key Reframe:
Channels do not compete in isolation. They co-produce outcomes across time.
Time-Lag Blindness
Another source of misinterpretation was the mismatch between reporting cadence and actual purchase timelines.
For a B2B industrial e-comm client:
Purchase cycles were longer.
Consideration periods extended beyond monthly reporting windows.
Paid exposure likely influenced future purchases, not same-month conversions.
Yet performance was being evaluated within monthly silos.
This contributed to:
False negatives for paid.
False positives for short-term spikes.
Overconfidence in same-month attribution.
My work introduced time-aware interpretation.
Multi-channel Path Ambiguity
There was acknowledgment that purchase paths were multi-channel — but no operational logic for using that information.
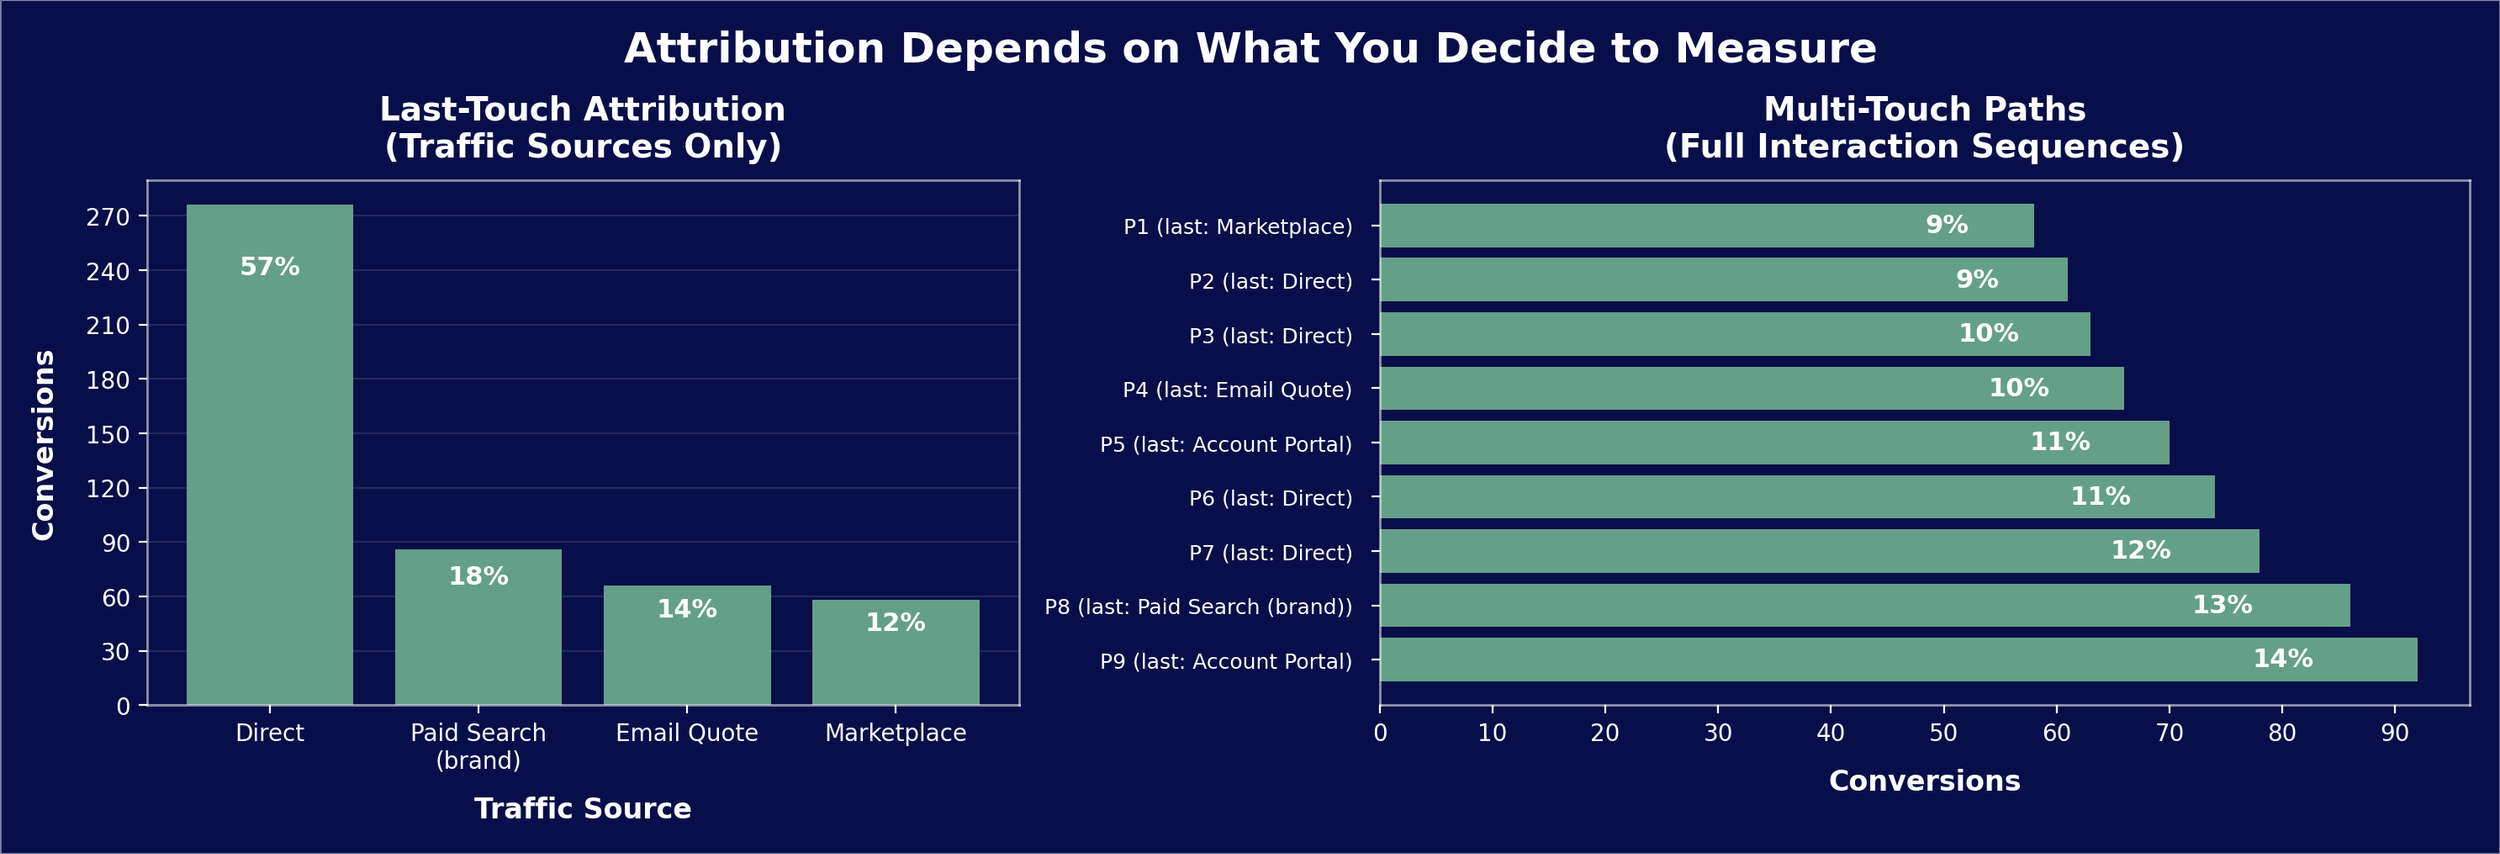
Caption. Channel-level reporting emphasized final interaction points, creating the impression that channels operated independently. Path analysis revealed that most conversions involved multiple touchpoints, often spanning weeks or months. Treating the last interaction as the primary driver obscured how channels reinforced one another over time.
My work proposed weighting influence structurally:
Implementing a proportional contribution scoring model.
Treating path sequence as meaningful, not incidental.
Moving beyond first-touch / last-touch binary attribution.
Distinguishing precedence from simple presence.
Revenue Leakage Ambiguity
Even after accounting for channel interactions and time lags, the overall revenue pattern still did not reconcile with observed customer behavior.
The discrepancy suggested that the system might not be fully visible within the existing measurement boundaries.
Revenue appeared to decline despite strong returning-customer performance.
This suggested that value might be entering or leaving outside the measured system — through untracked channels, sales-assisted conversions, or timing mismatches between exposure and purchase.
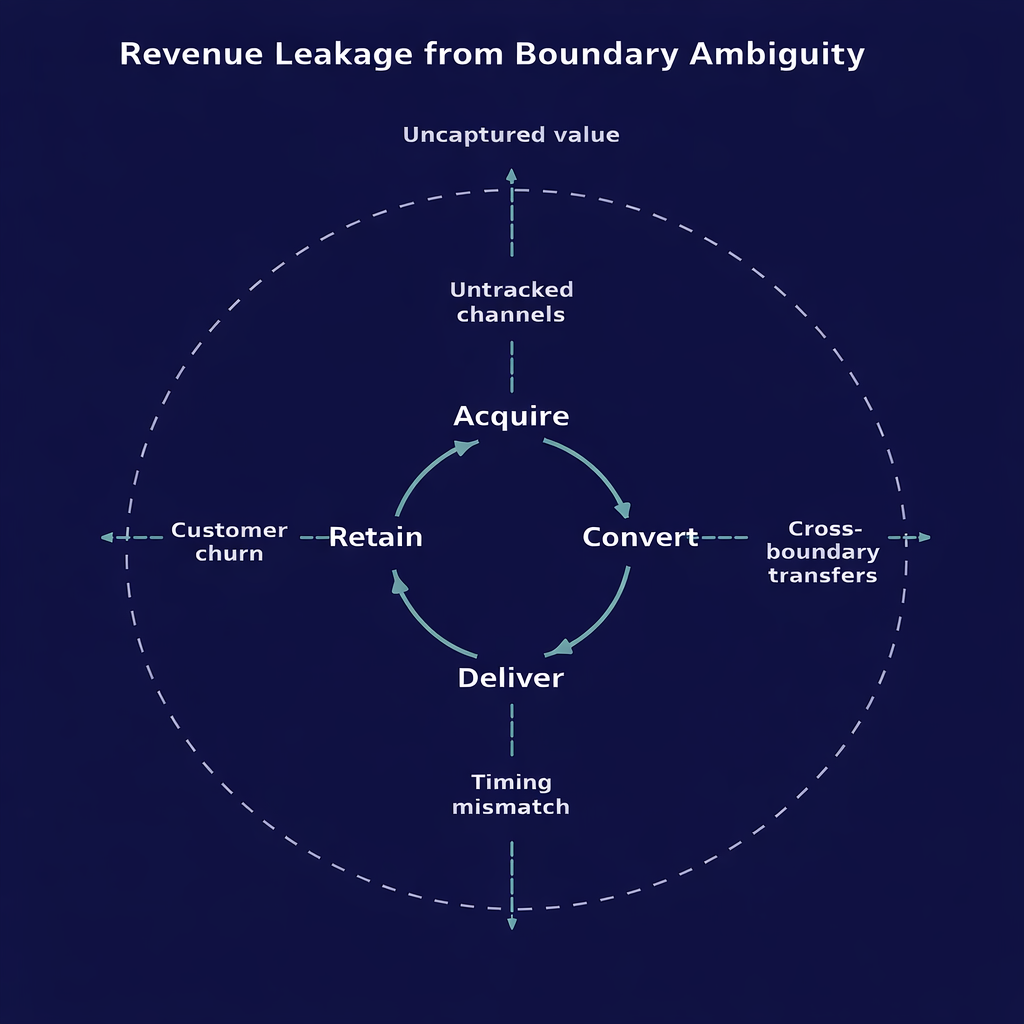
The problem was not necessarily performance, but incomplete visibility.
Returning customers were strongest revenue contributors YoY.
But:
Total orders were dropping.
Order size was shifting.
E-comm vs sales-lead return paths were not clearly tracked.
That meant it was impossible to identify whether the issue was:
Acquisition
Retention
Channel crossover distorting signal
Incomplete measurement architecture
Key takeaway:
The bottleneck could not be diagnosed cleanly because the system boundaries were blurry.
That’s a measurement architecture problem.
The analysis shifted focus from performance optimization to measurement completeness.
Even when boundaries were clarified, instability persisted, pointing to an additional interpretive issue.
Small-Sample Volatility Inflation
Another source of apparent instability was the statistical fragility of the data itself. Some volatility was not behavioral at all but a consequence of interpreting very small samples as if they represented stable trends.
For a B2B industrial client:
Purchase volume was low.
There were many zero-purchase days.
Small monthly shifts exaggerated percentage change.
There was no clear baseline for “good” performance.
Which meant:
Volatility was overinterpreted.
Noise was mistaken for signal.
Confidence intervals were ignored.
This is classic small-sample instability.
Intervention encouraged focus on confidence and context rather than percentage change alone.
Intervention Logic
Rather than prescribing tactics, the intervention focused on establishing decision architecture that could guide action under uncertainty.
Core intervention philosophy:
Decision architecture > reactivity
Stage-based diagnosis > ad hoc analysis
Measurement boundary clarification
Sequencing intervention
Interpretive discipline under volatility
Applying this philosophy introduced:
Stage-based evaluation before spend calibration
Cohort over snapshot analysis
Proportional path contribution modeling
Explicit distinction between descriptive and directional signal
Constraint on premature scaling
The core shift: Diagnose before calibrating.
In practice, this shifted conversations from reactive adjustments to structured evaluation of system position.
Structural Outcomes
Over time, these changes altered how performance was discussed and how decisions were made, even though underlying market conditions remained uncertain.
Decision conversations became more stage-aware
Revenue leakage questions became more precise
Volatility interpretation became more disciplined
Measurement architecture gaps were made visible
Attribution narratives were challenged with proportional logic
Adoption varied, but the system became legible.
Taken together, these analyses indicated that the organization was reacting to surface volatility while the underlying system remained relatively stable.
Improving decision quality required making interactions, delays, and boundaries explicit so that interventions could be sequenced deliberately rather than responsively.
Transferrable Method
The approach used here is not specific to marketing; it reflects a generalizable method for diagnosing complex systems under uncertainty.
This work reflects a consistent approach:
Identify stage
Clarify boundaries
Diagnose constraint
Respect signal weight
Sequence intervention deliberately
Revenue was the context.
Uncertainty was the constant.
Transferable Applications:
Ops transformation
Systems roles
Data leadership
Product strategy
Program design
Research design
The following example illustrates how this reasoning was applied in a concrete analytical task.
Micro-Example: Multi-Channel Path Diagnosis in Practice
During a transition to GA4, new path exploration tools became available for analyzing multi-touch purchase sequences.
At the time, performance was still being evaluated primarily through channel-level win/loss attribution, and the new tools were viewed as interesting but not immediately actionable.
A question arose about paid search performance amid cross-channel volatility.
Rather than evaluating PPC in isolation, I used the path tools to examine how paid media functioned within broader multi-channel purchase sequences.
The analysis shifted from asking, “Did paid win or lose this conversion?” to questions such as:
Where did paid appear in the purchase path?
Did it precede higher-value or repeat conversions?
Was it reinforcing or accelerating other channels?
Were certain path sequences more stable over time?
I documented a proportional contribution framework that treated channels as interacting components within a system rather than independent drivers.
This reframing did not eliminate ambiguity, but it made the system more legible and provided a more disciplined basis for interpreting performance under uncertainty.
The goal was not to assign perfect credit, but to reduce attribution overconfidence and clarify how channel interactions might inform spend calibration.
This work is grounded in my Revenue Research Program.