Designing a Revenue Research Program
A conceptual framework for diagnosing revenue systems under uncertainty
Context
This work emerged within a multi-channel B2B revenue environment characterized by persistent uncertainty and fragmented insight.
Decisions about marketing spend, channel emphasis, and growth initiatives were made on a rolling basis, often using incomplete or inconsistent evidence.
Data existed across multiple platforms, but it did not combine into a coherent picture of how revenue actually developed over time.
Analytical efforts tended to address narrow questions in isolation — campaign performance, website metrics, customer behavior — without a shared system model linking them together.
As a result, insights were difficult to integrate, compare across periods, or use confidently for directional decisions.
The need was not simply for more analysis, but for a structured way to understand the revenue system as a whole.
Origin of the Program
The research program was not commissioned as a formal initiative. It emerged organically from ongoing analytical work, including path analysis, proportional attribution modeling, returning-customer studies, and cross-channel investigations.
As these efforts accumulated, recurring patterns became apparent.
Similar uncertainties surfaced across projects, key questions overlapped, and findings pointed to underlying structural issues rather than isolated tactical problems.
This revealed that the analyses were implicitly exploring a common system, even though they had not been framed that way initially.
Recognizing this, the work was consolidated into a coherent research program designed to:
Make the system model explicit
Organize inquiry around fundamental questions rather than ad hoc requests
Enable cumulative learning across analyses
Produce insight that could guide decisions over time
Parts of this program were implemented directly through specific studies, while other components served as a conceptual framework for future investigation.
The visuals below illustrate interpretive risks that arise when analyzing complex revenue systems.
These visuals serve as reasoning aids rather than performance dashboards. They summarize recurring analytical challenges observed across multiple investigations rather than results from a single project.
The Problem It Addressed
The primary challenge was epistemic rather than operational: decisions were being made under uncertainty without a reliable way to interpret available information.
Key issues included:
Analyses answering isolated questions without building shared understanding
Inability to assess whether observed changes were causal, coincidental, or cyclical
Conflicting signals across channels and time periods
Limited visibility into how different parts of the revenue system interacted
Difficulty distinguishing meaningful trends from noise
The organization lacked an organizing mechanism for accumulating knowledge about what drove revenue and when intervention would be effective.
Systems under uncertainty cannot be understood from isolated metrics alone.
Without a structured approach, each new data point risked triggering reactive adjustments rather than informed strategy.
System Model of Revenue
The program conceptualized revenue as a dynamic system rather than a collection of independent performance metrics. At a high level, this system included interconnected stages such as acquisition, consideration, conversion, retention, and return behavior, each influenced by multiple channels and external factors.
Key characteristics of the system included:
Cross-channel interactions rather than isolated effects
Time lags between exposure, intent formation, and purchase
Recurring behavioral cycles among returning customers
Variation in purchase readiness across segments
External influences such as seasonality, market conditions, and awareness activity
Understanding these dynamics required moving beyond snapshot reporting toward longitudinal and relational analysis.
The goal was to identify where constraints existed, how information propagated through the system, and which interventions were likely to produce meaningful change.
Before examining specific inquiry domains, it is useful to recognize several interpretive traps that distort revenue signals. These are not anomalies; they are recurring features of complex systems observed through incomplete measurement.
Interpretative Traps Across Domains
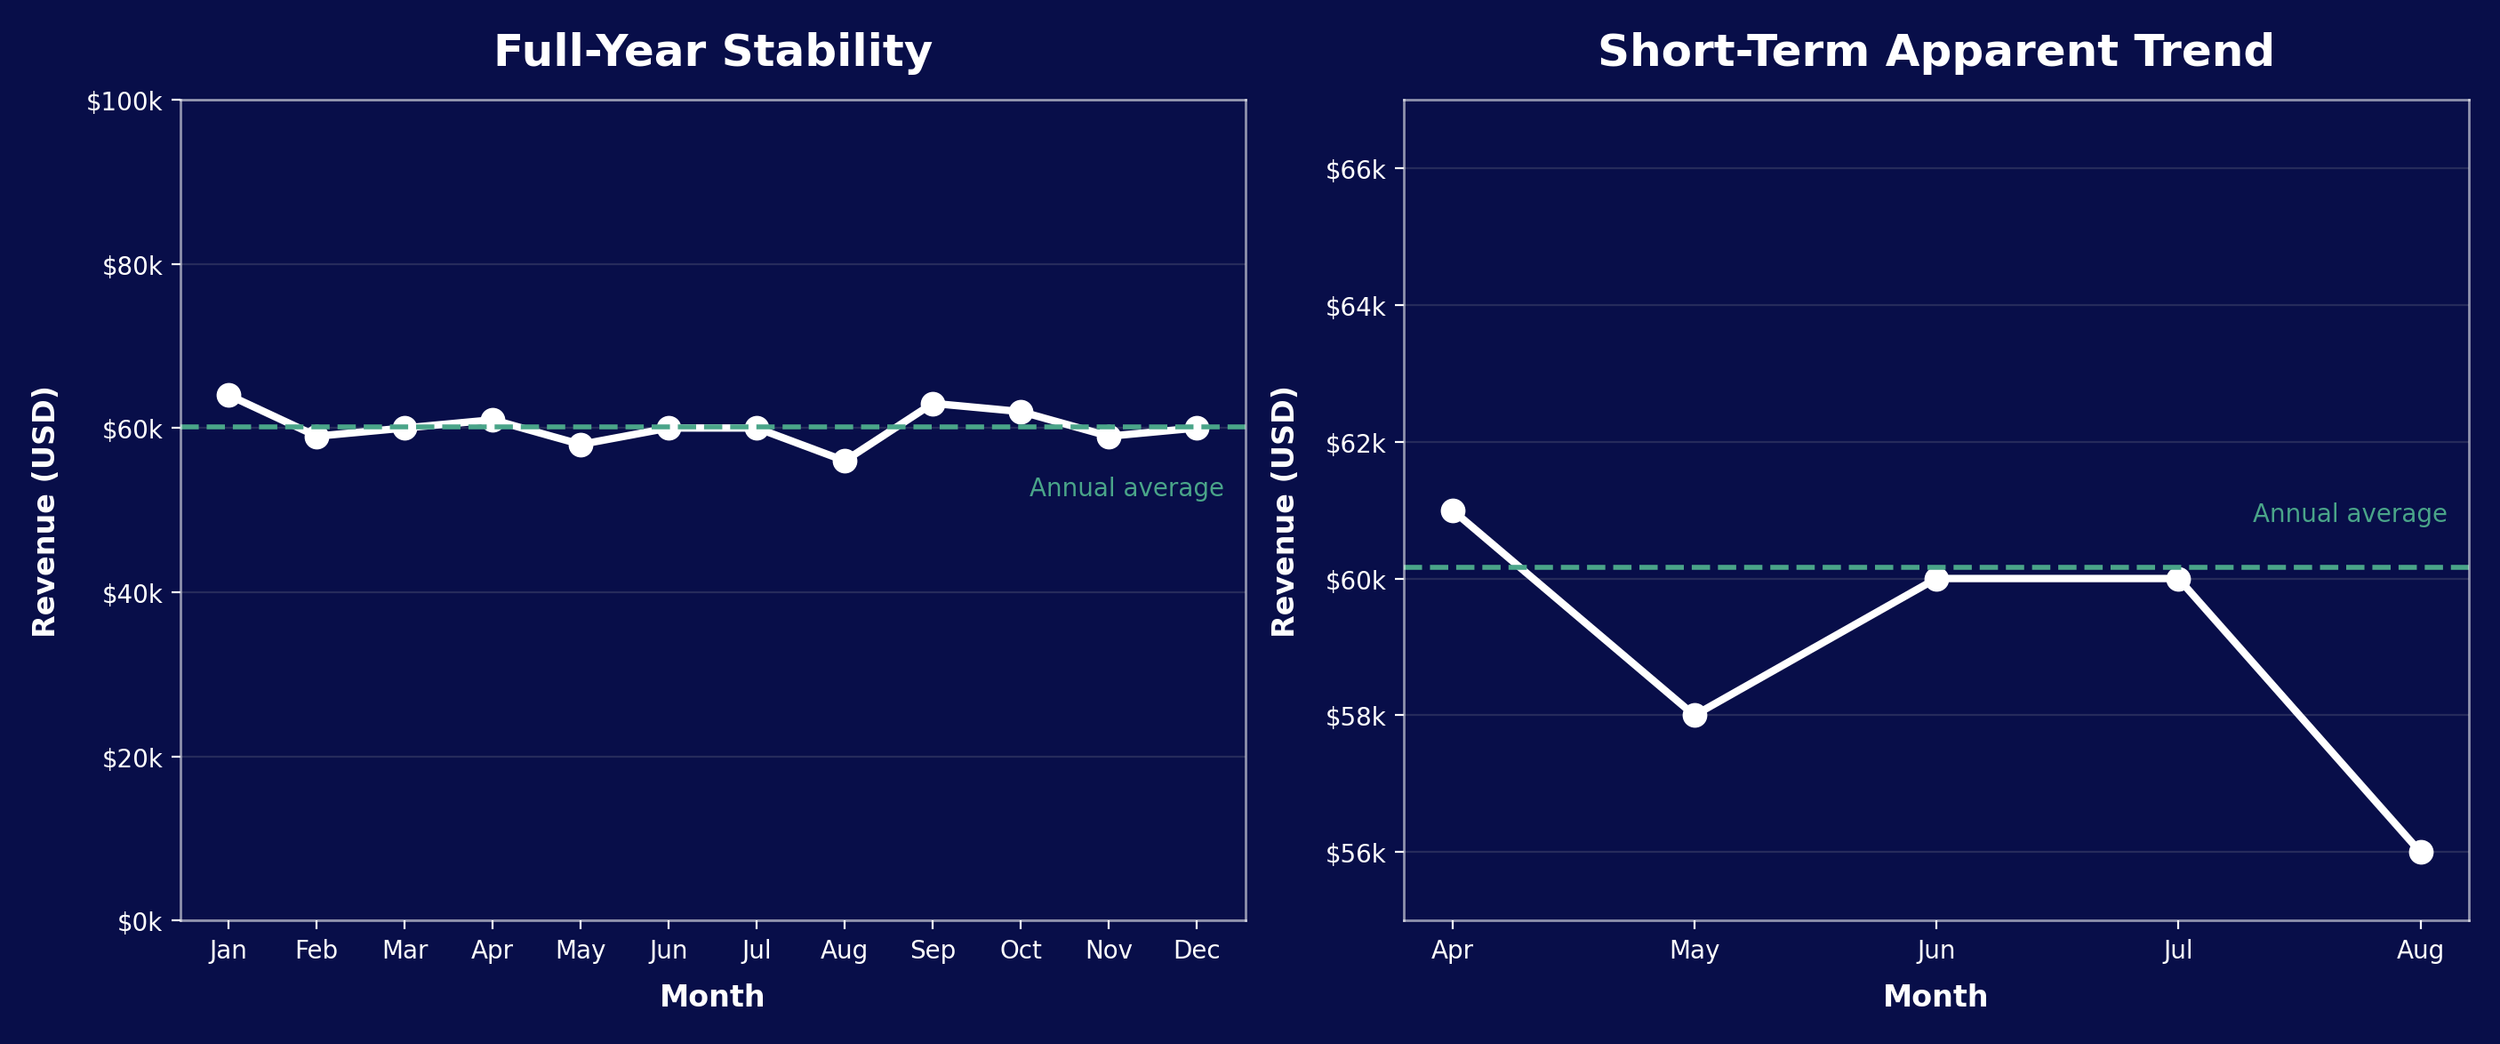
Caption: Short-term trends can appear significant but fall within normal variation when viewed across a full cycle.
Narrow observation windows amplify noise and invite narrative. When placed in long-term context, the same variation may fall within expected system volatility. Interpreting short-term movement without baseline awareness can lead to premature conclusions and reactive decision-making.
Decisions made from truncated views tend to address perceived crises rather than structural conditions.
System-level evaluation requires comparison against historical variability to distinguish signal from noise.
Apparent instability can also arise when the amount of data is small, even if the underlying process is unchanged.
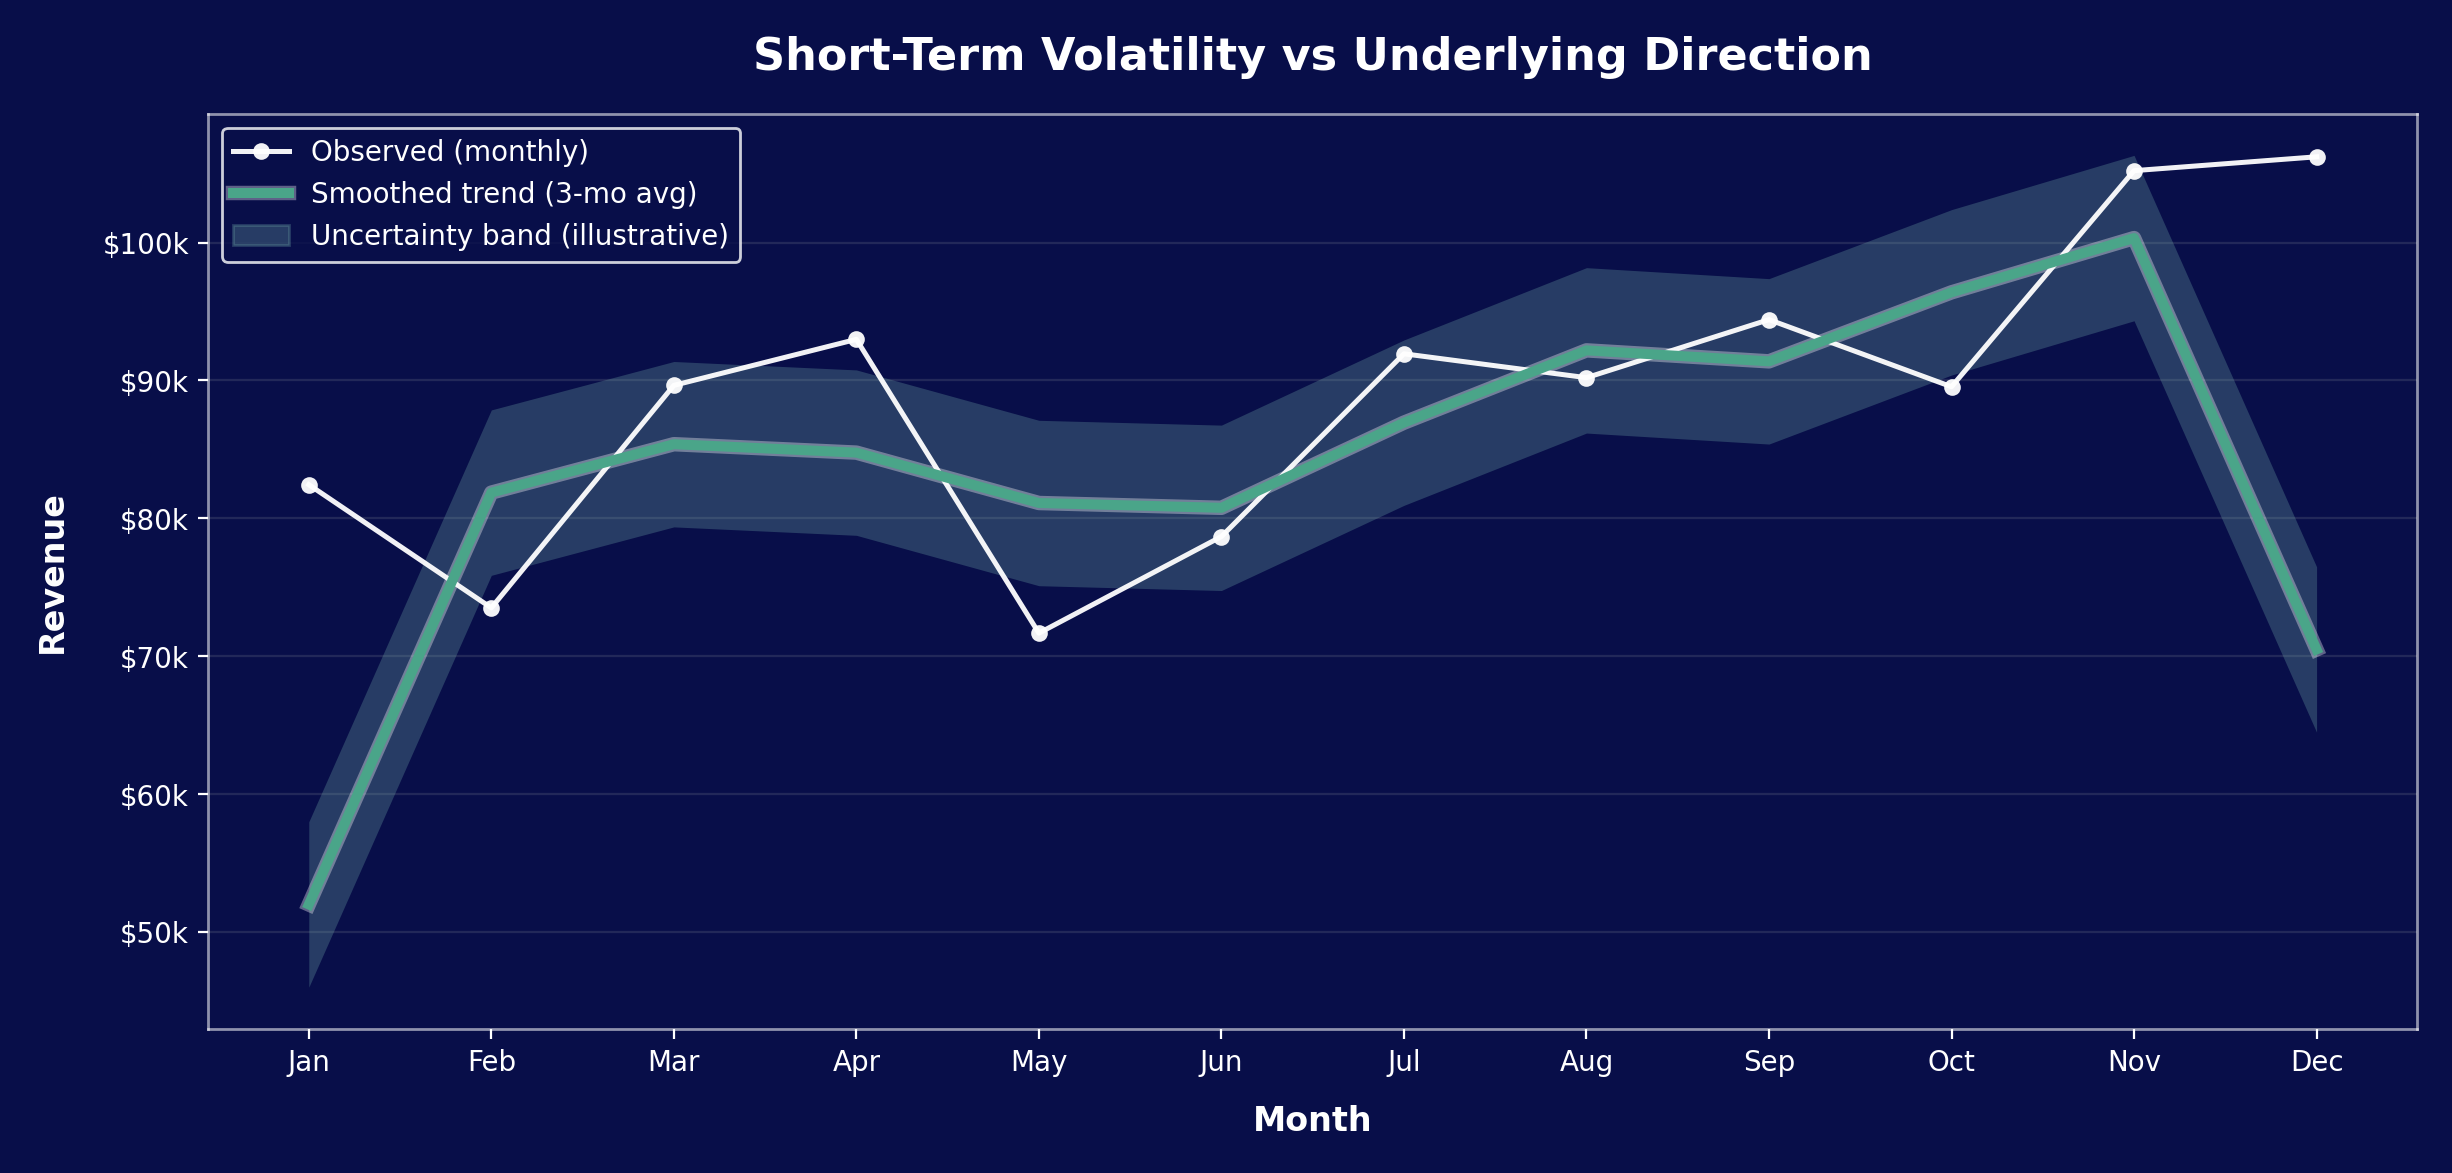
Caption: Short-term fluctuations can appear meaningful when sample sizes are small. Smoothing reveals the underlying trajectory, which may differ substantially from the direction implied by recent observations.
In low-volume environments, variance dominates early observations. Apparent surges or declines often reflect sample size rather than directional change.
Without explicit uncertainty awareness, organizations risk reacting to statistical noise as if it were meaningful signal.
Inquiry Architecture
To investigate this system systematically, the program organized research into coordinated domains rather than standalone projects. Each domain addressed a different aspect of uncertainty while contributing to a shared understanding of revenue dynamics.
Core inquiry areas included:
Path Analysis and Proportional Attribution Modeling
Path Analysis
Mapping multi-touch customer journeys to understand how channels worked together, the typical sequence of interactions, and where drop-off occurred.
Proportional Attribution Modeling
Estimating the relative contribution of different channels and touchpoints without assuming single-cause attribution, enabling more balanced evaluation of performance.
The same set of purchases can tell very different stories depending on what is measured. Conventional attribution models assign credit to the final traffic source, which often appears decisive.
When the full sequence of interactions is considered, purchases are better understood as the result of extended discovery, research, and return behavior across time rather than a single channel in a single moment.
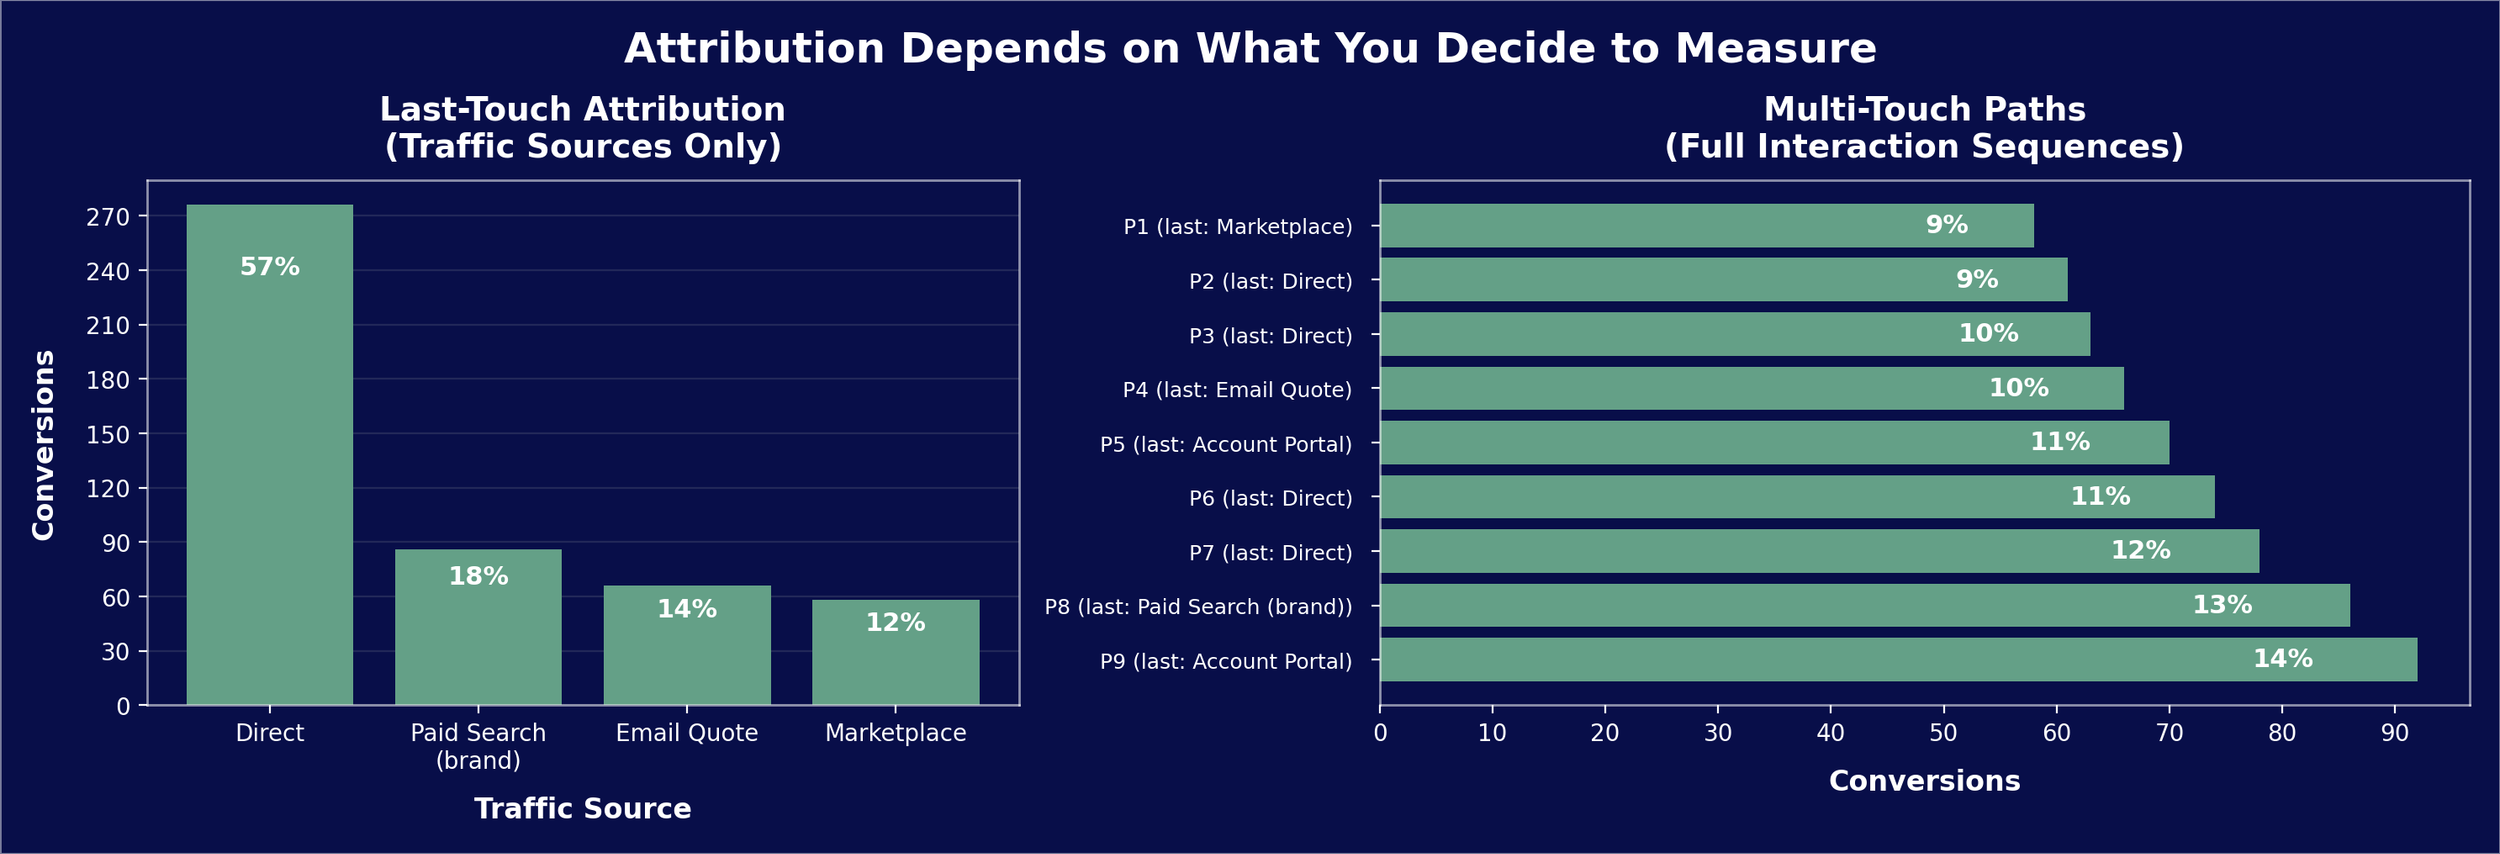
Caption: The left panel (Last Touch) informs the question: “Which channels appear to drive conversions?” The right panel (Multi-Touch Paths) informs a more nuanced question: “Do certain sequences produce more conversions?”
Revenue events typically emerge from sequences of interactions rather than single causes. Last-touch metrics compress this sequence into one visible endpoint, overstating the importance of the final interaction while obscuring earlier influences.
Multi-touch analysis does not eliminate ambiguity, but it reveals that channels function as interdependent components rather than isolated drivers.
Representative Purchase Paths
P1: Marketplace → Product Page → Marketplace
P2: Referral → Product Page → Direct
P3: Paid Search (non-brand) → Product Page → Display Retargeting → Direct
P4: Email Quote → Direct → Product Page → Email Quote
P5: Email Reminder → Direct → Account Portal
P6: Organic Search → Spec Sheet → Category Page → Direct
P7: Organic Search → Product Page → Direct
P8: Organic Search → Category Page → Spec Sheet → Paid Search (brand)
P9: Organic Search → Category Page → Direct → Paid Search (brand) → Account Portal
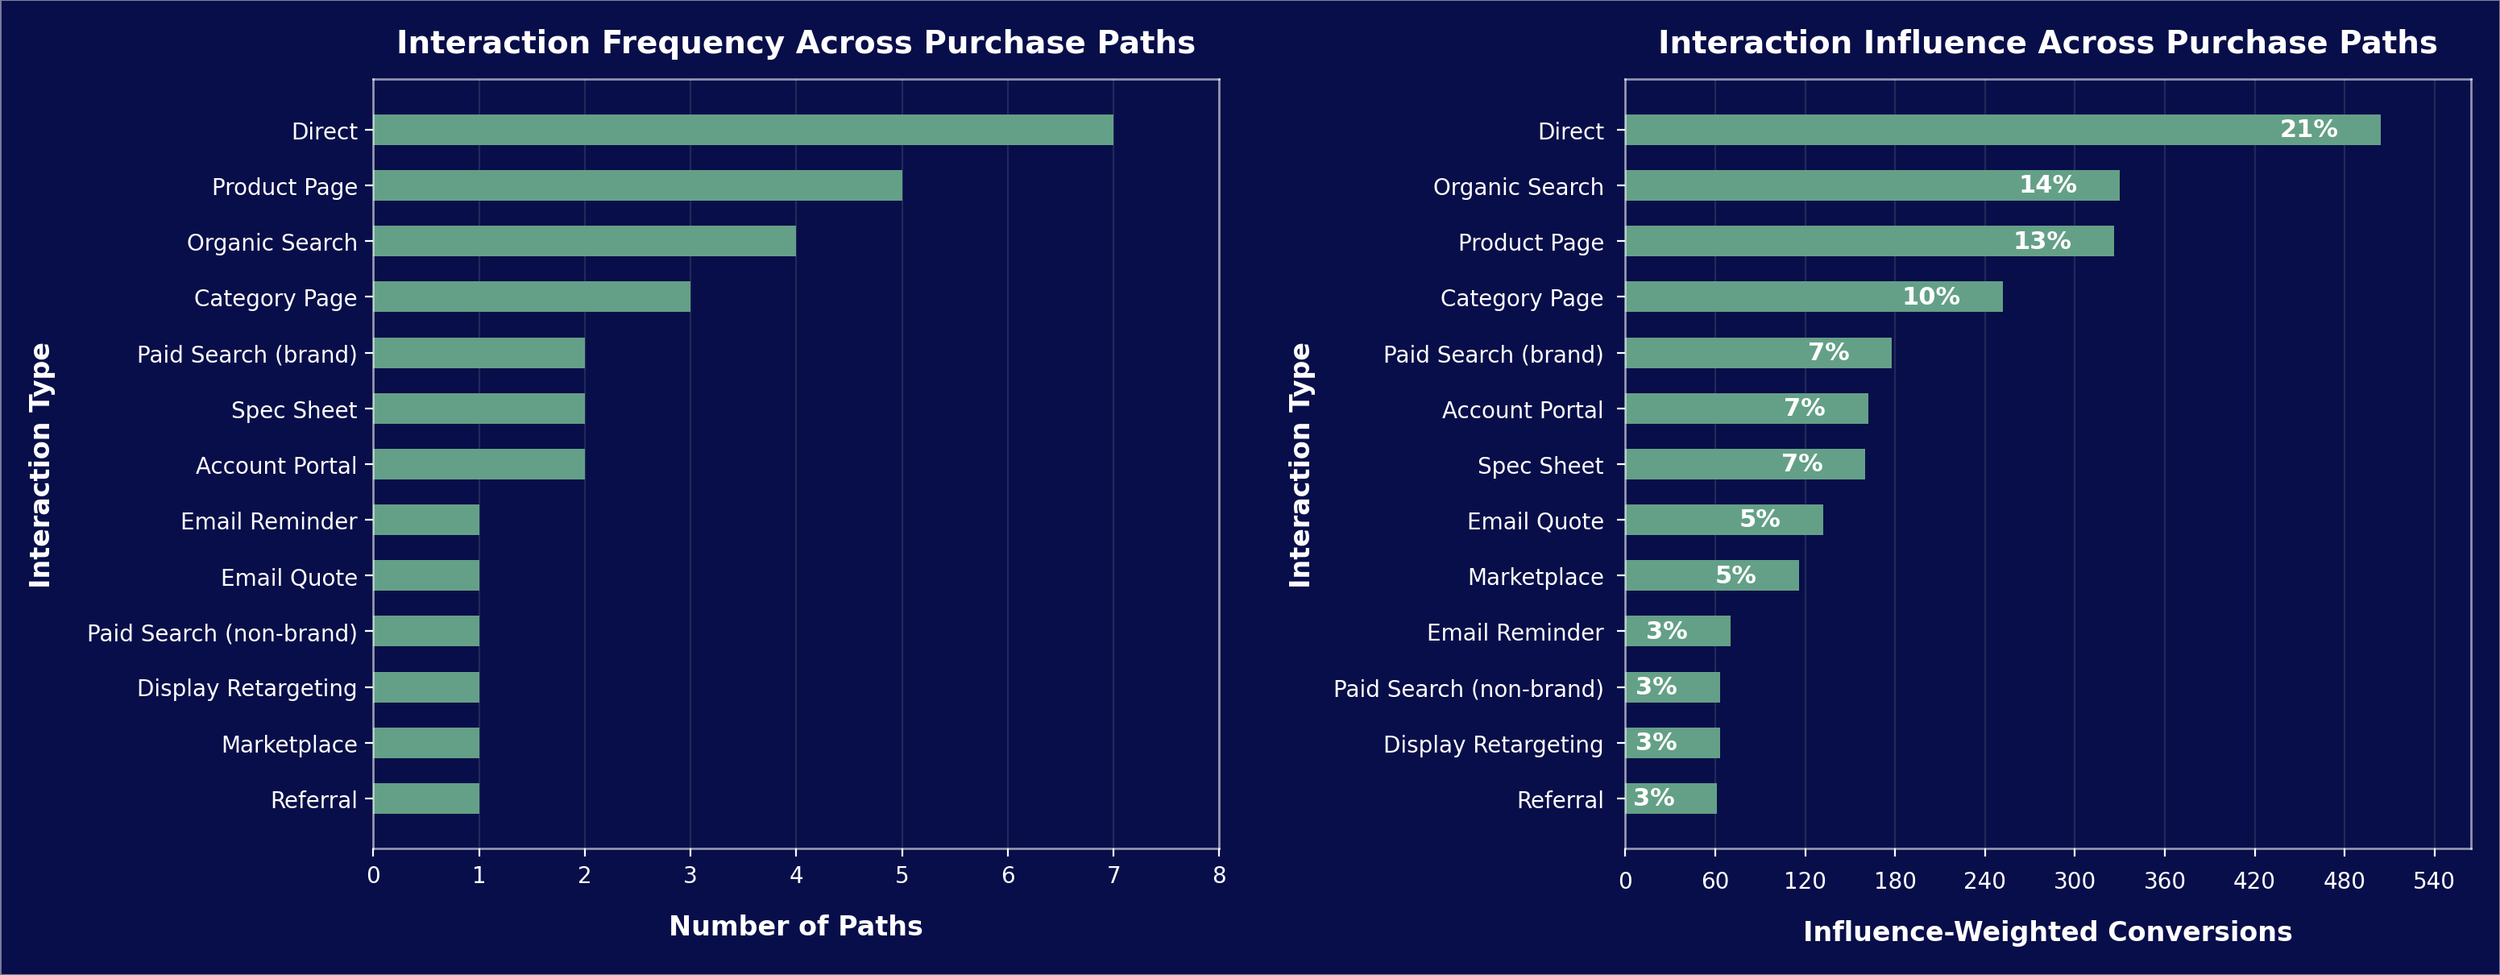
Caption: The left panel (Interaction Frequency) informs the question: “Which channels frequently appear in journeys?” The right panel (Interaction Influence) informs the question: ““Do longer journeys convert more?”
This key re-frame moves the analytic focus from:
“Which channels uniquely caused conversions?” to “Which channels participate most in conversions?”
This distinction is especially important in B2B contexts where research activity often occurs across multiple sessions before purchase.
Returning-Customer Dynamics
Analyzing repeat purchase behavior, purchase cycles, and the relationship between acquisition activity and long-term revenue generation.
Cross-Channel Interactions
Examining whether activity in one channel influenced performance in others, including spillover effects on direct and organic traffic.
Spend Optimization and Timing
Investigating diminishing returns, seasonal patterns, and latency between marketing actions and observable outcomes.
Revenue systems are dynamic, delayed, and context-sensitive. Revenue responses may lag interventions by months.
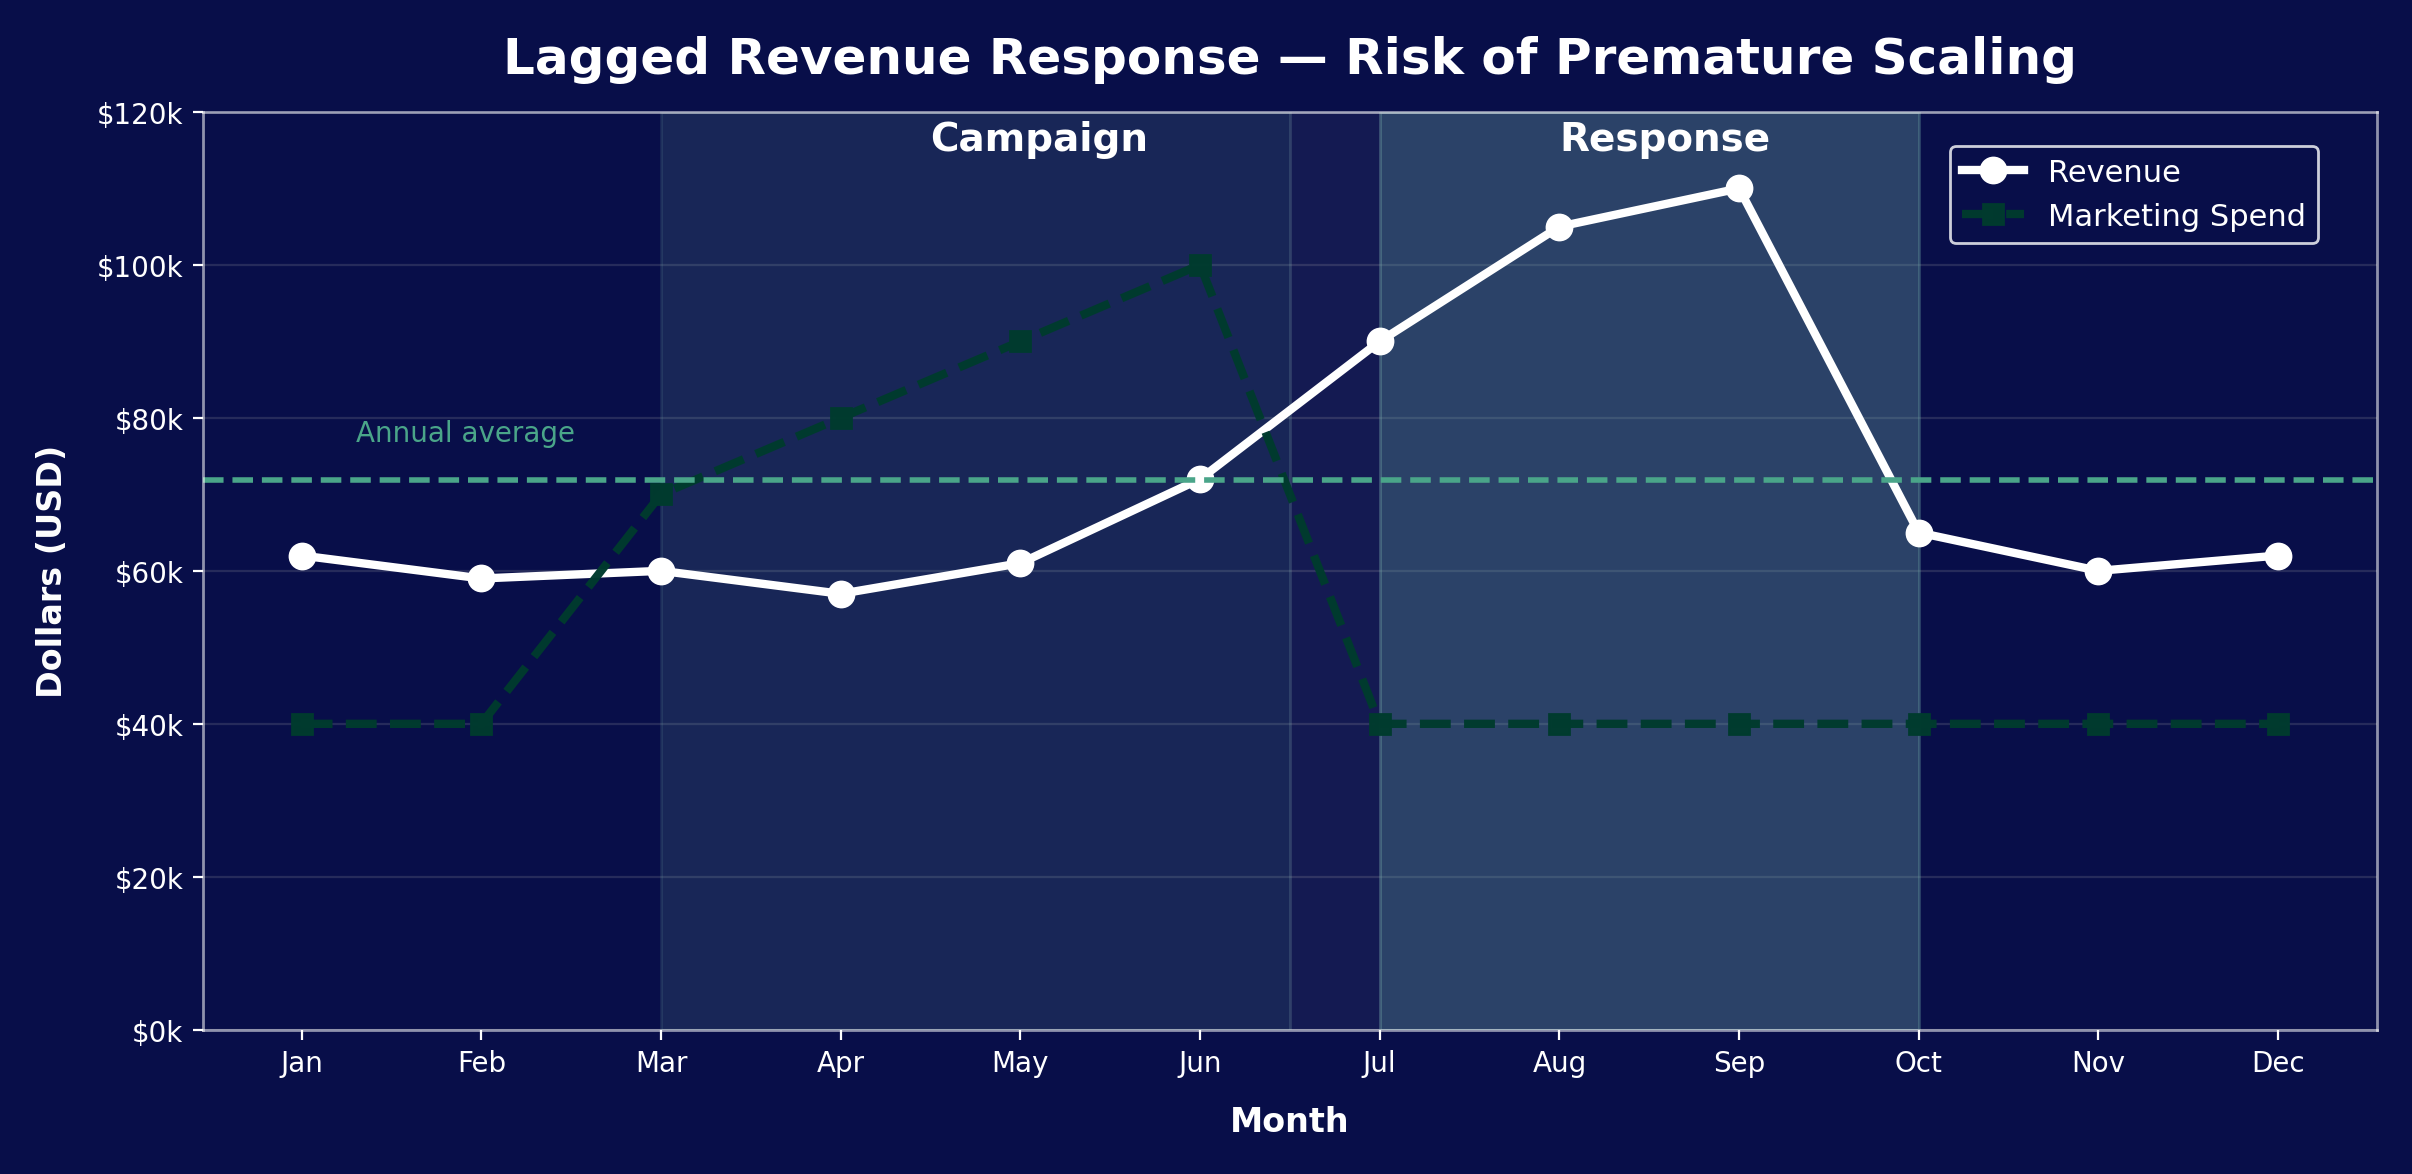
Caption: Apparent success during a revenue upswing may reflect delayed effects of earlier interventions rather than current actions.
Assuming that rising performance reflects current inputs rather than prior actions can produce costly overreaction, misallocation of resources, and strategic drift in systems with long purchase cycles.
Interventions rarely produce immediate measurable effects.
Revenue may respond only after awareness builds, budgets cycle, or customers reach purchase readiness. Evaluating performance within short reporting windows can misclassify effective actions as failures and encourage premature changes.
External and Structural Factors
Considering market conditions, competitive activity, and organizational constraints that shaped revenue independently of specific campaigns.
Together, these domains formed a coordinated inquiry architecture designed to reduce uncertainty progressively. Insights from one area informed questions in others, allowing the program to evolve as understanding deepened.
Implementation
The research program was partially implemented through a series of focused studies rather than as a formally resourced initiative.
Path analysis, proportional attribution modeling, returning-customer dynamics, and cross-channel investigations were conducted under this framework, each contributing to a growing understanding of how revenue developed over time.
Because the program originated from personal initiative rather than organizational mandate, adoption varied. Some findings informed ongoing discussions about performance, spend allocation, and measurement gaps, while other components served primarily as conceptual scaffolding for future analysis.
Resource constraints, competing priorities, and limitations in available data meant that not all planned inquiries could be executed fully. Even so, the program provided a shared reference point that helped move conversations away from isolated metrics toward system-level reasoning.
The revenue research program highlighted where additional instrumentation or process changes would be required to answer critical questions more reliably.
Revenue systems extend beyond the activities typically measured as marketing or sales. Value can enter or exit through untracked channels, delayed conversions, or cross-boundary interactions.
When measurement boundaries are incomplete, performance appears to deteriorate even when the underlying system is functioning.
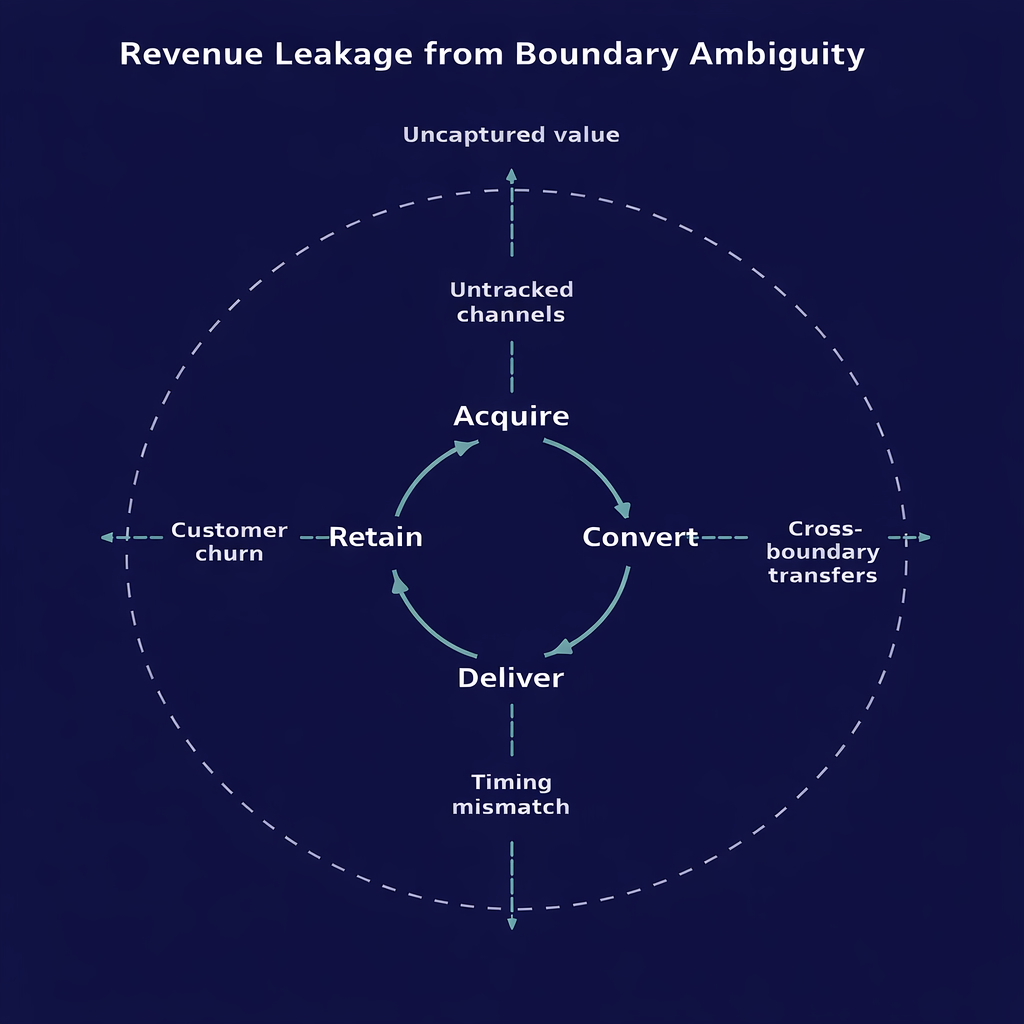
When system boundaries are poorly defined, value flows “leak” across them — creating suboptimal measurement, misplaced incentives, and bad decisions.
Key Insights and Learnings
Several insights emerged from the work, both about the revenue system itself and about the process of investigating complex environments.
Revenue dynamics were shaped by interactions rather than isolated effects.
Performance changes in one channel often reflected activity elsewhere in the system, making single-channel evaluation unreliable without broader context.
Time lags played a critical role in interpreting results.
Actions frequently produced observable effects only after significant delays, which created a risk of overreacting to short-term fluctuations or prematurely abandoning effective strategies.
Returning customers represented a structurally important but poorly understood component of revenue.
Repeat purchasing behavior followed cycles influenced by prior acquisition activity, product need, and market conditions, underscoring the importance of longitudinal analysis.
Measurement gaps constrained decision quality as much as performance issues did. In several cases, uncertainty persisted not because outcomes were unknowable, but because the necessary data was not being captured or integrated effectively.
Beyond domain-specific findings, the experience reinforced a broader lesson:
Structured inquiry can reduce uncertainty even when perfect data is unavailable.
By organizing questions, clarifying assumptions, and accumulating insight systematically, it becomes possible to act with greater confidence despite incomplete information.
Transferable Capabilities
Designing inquiry under uncertainty
Integrating methods into systems
Building decision infrastructure
Acting without formal authority
Closing Perspective
This work illustrates how structured investigation can convert persistent uncertainty into actionable understanding — even without perfect data or formal mandate.